Analytics Tools for AgriFood Supply Chains
Best Practices for Business Insights
In this article we will take a look at the business analytics tooling also known as business intelligence (BI) tooling from agri-food supply chain perspective.
Before we begin, BI has a long history and it means different things to different people depending on their age, experience, sector they work in, and skillsets. To clear that understanding, Tableau has a good article on what BI is.
What are Business Analytics Platforms?
Business analytics platforms, sometimes known as business intelligence (BI) platforms, are platforms that provide a tool set for businesses to absorb, organise, discover, and analyse data to reveal actionable insights that can help improve decision-making and inform business strategy.
These tools are supposed to have five key elements:
Data preparation
Data modelling
Data blending
Data visualisation
Insights delivery
The primary purpose of these systems is to enable non-IT users (or business users or the domain experts) with a set of tools which will help them to understand the day to day performance of the business and help make data driven decisions with minimal IT or software engineering work.
The business users can use these tools to generate reports, dashboards and visualisations. These platforms help business users understand the connections and trends between multiple datasets and get the holistic view of the business. They can be used in the daily/weekly/monthly team or management meetings to make business decisions.
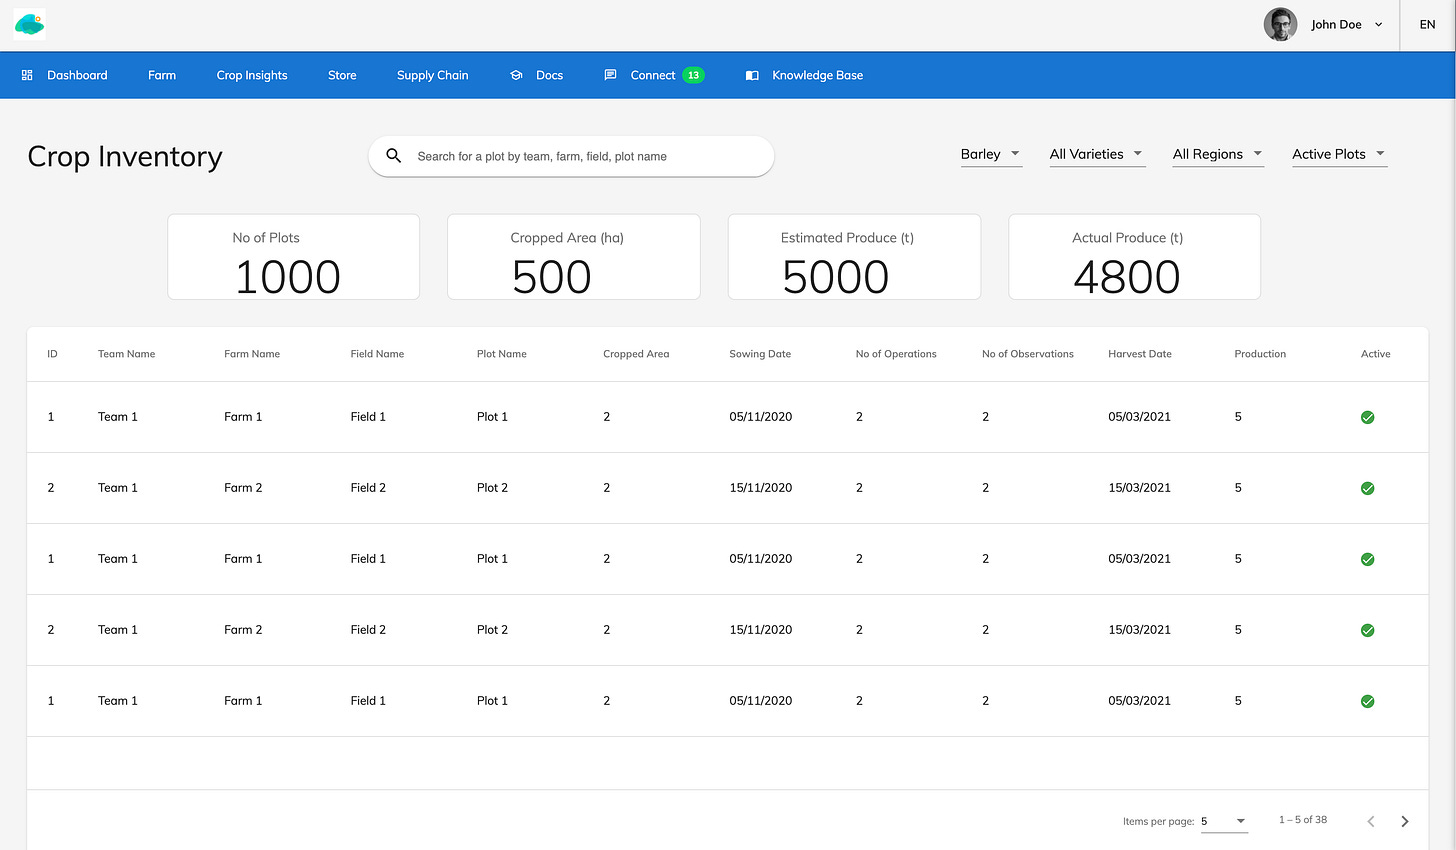
The dashboards are like your head torch when you are climbing the mountain in the dark. For example, the dashboard below shows the “crop activity and progress” across the supply chain. The Procurement Manager can use this to plan the crop procurement activities and track the progress.
The key thing to note here is the steps listed above, from 1 to 5, is the journey businesses have to go through. Without a proper data capturing, preparation, blending mechanism, one cannot have standardised dashboards and metrics to monitor the business performance.
We often see business leaders who want to go to step 5 without going through the previous steps of the infrastructure and data preparation exercise which are critical to the success of the project.
Landscape for BI and Analytics Tools
Source: Gartner (February 2021)
From the image above we can see there are a lot of players in this space and few have really done a great job and are leading in satisfying the end users business needs. Helping the stakeholders (data scientist, business analyst, business users) visualise and make data driven decisions thus helping businesses to understand the intricacies of their supply chain, connections and seasonal trends.
These tools have definitely benefited larger enterprises in tackling the day to day performance challenges of their business, however, the enterprises especially in the agrifood supply chain are still facing challenges.
These challenges are primarily because of the disconnected and siloed data capturing systems built or implemented over time. Without having a unified enterprise data architecture the insights delivery is impossible.
Based on our experience, the following few BI software solutions standout for their performance, visualisation, ease of use and user experience:
Although, these tools provide flexibility and allow business users to create “self-serviced dashboards”, the total license cost per annum can be exorbitantly high depending on what features are being used and the number of user licenses requested. This is where proper planning and doing a cost analysis before hand would come handy.
Challenges in The AgriFood Supply Chain
Even though it is one of the oldest trades, the agrifood supply chain is still catching up with digital technology. The challenges one has to consider when using the BI tools in the agrifood supply chain are:
Contextuality
Heterogeneity
Fuzziness
Contextuality
Agricultural production depends on so many factors: weather, cultivar, soil, cultivation practices, pest and disease infection, supply and demand. Some of these factors are controlled by humans while some are beyond human control. Thus, when looking at the data collected through various systems, for e.g., weather stations or agricultural inputs, crop observation and quality samples, one has to use a holistic approach before drawing any conclusions based on the trend single or part combination of data represents. In order to do so procurement managers, agronomists, technical and commercial managers need to collaborate effectively and efficiently using the relevant tools.
Heterogeneity
The upstream and downstream of the agrifood supply is using the tech which collects and handles data in a non-standardised way, often appropriate to the nature of the data they are dealing with. Thus, data is captured in both structured as well as unstructured fashion.
Due to the heterogeneity of the data collected, it often requires technology experts' support to perform the necessary steps pertaining to data handling (preparation) to get it in a shape/form alongside business users. Once data is prepared the business users can start using it in the next steps of data handling (modelling, blending) based on the requirements.
Fuzziness
Lot of data collected in the agri-food supply is fuzzy, i.e., not precise. Most data collected will also be described in range rather than precise numbers or measured qualitatively rather than quantitatively. Thus, transforming qualitative data into quantitative datasets pose another challenge. The rules, regulations and standards are different in different countries making it further challenging to handle these datasets. We also need to integrate automated and remote data collections solutions for consistency in data recording and timely monitoring of crops in the field/store.
Data Architecture
Every agrifood business leader we have spoken to has an ambition to enable their team to make data driven decisions. However, very few realise the groundwork needed for a well functioning system which will allow users to glean insights or the work needed to take those insights to the business users in their operational setting.
The first step in laying the right foundation is to break all of the organisational data silos and allow the data to flow seamlessly. This does not need a fancy technology or does not mean investing huge sums of money upfront - what this means is working smartly, in an agile way, asking your software vendors to comply with certain interoperability standards, getting access to their APIs and glueing the systems together to create that unified data architecture for the business.
The diagram below shows how the organisation’s data architecture should look like:
Key Questions
Every enterprise in the AgriFood supply chain is trying to answer following typical performance questions:
How is the crop/commodity doing in the field/store?
Do we have risks in fulfilling the customer contracts?
Do we have right quality of the produce being grown to meet customer specifications?
Who are my best growers? How are growers in my supply chain performing?
Are all my growers compliant across all of the supply chain standards? Are they following right protocols?
Do I need to buy on the open market this season?
What is the RoI per field or per grower or per store?
How can I mitigate the supply chain risks?
Some examples of the typical dashboards used in the supply chain:
RoI and Benefits
Most of the proprietary BI software platforms are costly without seeing the return on investment for 9-12 months in the traditional standardised business setups.
However, agrifood supply is not the same as traditional business setups for the above mentioned reasons. The commodities traded through agrifood supply chain take a full growing season to grow. The growing season can vary from 6-12 months depending on the commodity being produced. Enterprises will have to build visibility throughout the growing season, i.e., from seeds going into the ground till they reach to the consumers plate.
In the agrifood supply no growing season will be identical owing to the crop rotation, weather and other factors in the agriculture. Thus, data modelling and building the understanding of the trends will take a few growing seasons. Thus the real return on investments won’t start unless a couple of growing seasons, i.e., at least 24 months. This seems like a long time. However, careful planning and good preparation work in data plumbing can help enterprises realise that RoI quicker.
Conclusion
Using the BI tools in the agri-food supply chain is not as straightforward as the traditional business owing to the non-standardisation and complexity mentioned above. In order to get the true picture to generate valuable and actionable insights we need to build an ecosystem (integration of software services) through which data can be integrated, shared seamlessly and used across the systems where it is needed. This plumbing system for the seamless data flow across the organisation and outside is an essential condition for the delivery of the insights. This requires a careful planning and a clear thought process from the business leaders.
If you enjoyed this article, please follow @SachinAShende on Twitter and support our efforts on making the agri-food supply chains Efficient, Transparent and Sustainable by sharing this article.
We would love to hear your feedback.


Thank you for wonderful blog.
Learning a lot